
Monthly Market Update — November 2021

This month’s newsletter looks at the latest developments and key issues facing markets as we head into the latter part of the year.
The main points are as follows:
Inflation remains in focus and is running higher than expected.
The bond markets have moved and are now expecting higher interest rates as early as next year.
Central Banks are starting to step away from their ultra-supportive stance.
Markets to date have been comfortable with this change.
This may be challenged should inflation remain higher for longer.
Two key parts of the 2022 economic puzzle are the consumer and global supply chains.

US inflation data has been the focus of many investors over the last few months. The monthly data point providing insight into the state of the US economy and clues to future US Central Bank actions. With inflation pressures building in the US, the US bond market has started pricing in the prospect of higher US interest rates in 2022 or 2023.
Back at home, higher Australian interest rates were only expected in 2024 as forecast by the Reserve Bank of Australia (RBA). Supporting this has been the prolonged east coast lockdowns and the expectation of a slow reopening.
That has all changed now. Lockdowns are ending and borders are reopening. September quarter inflation data came in at +0.80% and +3.0% for the last 12-months. This prompted bond traders to challenge the RBA (selling fixed rate bonds) and the RBA did not defend. The market now expects higher Australian interest rates as early as next year.
At its 2 November meeting, the RBA walked back on the timing of future interest rate hikes. No mention of 2024, instead opting to focus on outcomes before hiking interest rates. “Inflation sustainably within the 2-3% range” and a “labour market to be tight enough to generate wages growth”. Concluding “This is likely to take some time”.
Our conclusion, the end to cheap money is much closer today than initially expected. The bond market certainly thinks so and the RBA agrees (with some conditions). The equity market is however looking the other way. For how long can the equity market party go on? The bulls will say there is a lot of money still in the system. The bears will say we are running on borrowed time.
In this newsletter, we look at 3 critical parts of the 2022 economic puzzle. Will US consumers go out and spend to power the US economy? Will supply chain woes add pressure to corporate profits? Will the divided Washington agree on future debt-funded spending?
These challenges facing investment markets should not be ignored. We continue to cautiously invest for the long term leaning into our investment strategy focussing on liquidity, quality, and diversification.

Consumers and Wall Street Don’t Agree.
The last 18-months has seen the market have eyes only for the US Fed. Buying the dip and posting weekly record highs. Now the US Fed is about to slow the printing presses. Who will take over?
The US consumer has a role to play as it has for decades. The US consumer is however not feeling as optimistic as Wall Street. Seemingly taking note of things which Wall Street is happy to overlook.
The below chart highlights the relationship between US consumer confidence and the US S&P500 Index. Historically, they have moved in unison which is not surprising given consumer confidence is a key driver of corporate earnings and therefore stock markets.

This relationship is broken today with low levels of confidence and elevated share markets. What does this mean for consumer spending as we enter the critical 4th quarter of the year and head into 2022?
Higher prices are seeing consumers shy away from buying large ticket items. Plans to buy a car is at the lowest level since 1974, homes the lowest level since 1982, and household durables the lowest level since 1980.
Furthermore, US Consumer Inflation Expectations are running at 5.3%. Much higher than Wall Street’s 2.7%, and the US Fed’s 2.3%. Differeent measures, but still much lower than what consumers are expecting.
Concerningly, Wall Street is betting companies will protect profits (against rising costs) by raising selling prices. This is difficult when consumers have little propensity to spend, especially on large ticket items.
We are not convinced consumers will absorb all the higher prices in the pipeline. Raw material costs, manufacturing costs, employment costs, shipping costs, etc.
Supply Chain Woes.
The web of daily transactions and activities a business requires to deliver its goods/services to consumers is known as a “supply chain”.
This supply chain is currently disrupted/dislocated placing multiple pressures on businesses. Most recent is the movement of goods as shipping lines are fully booked and ports in Asia and the US are congested.
As at mid-October, it took roughly 73 days for sea freight to make the China-to-U.S. trip. Roughly as many days to Christmas meaning any freight not already on the water is unlikely to make it onto Christmas shelves.
The below chart highlights the complexity of global shipping routes. Industry insiders say carriers are “not interested” in signing new contracts until aGer February (Chinese New Year holiday) as bookings remain full.

How well companies were prepared for this will determine the impact on 4Q21 earnings. A record 3,000 mentions of the word “supply chain” on investor calls could lead one to believe corporates were prepared.
The supply chain challenges from earlier in the year was however from higher raw material costs and disrupted manufacturing (COVID-19 restrictions). The logistical challenge is a more recent occurrence.
The market is looking through the logistical nightmare. The Biden administration has also pushed the Port of Los Angeles to begin 24/7 operations to alleviate some pressure.
This is seeing pressure shift from shipping lines and ports onto storage facilities and trucking companies. This once again brings the US labour market into the spotlight. More job vacancies than job seekers.
Raw material costs are elevated, energy costs are rising, shipping costs are rising, wage pressures are building. How much more can US corporates handle? Can they handle the thought of higher interest rates?
The Debt Clock Runs 24/7.
It’s US debt ceiling time, again. This time the divide in Washington makes this worth paying attention to as we close out the year.
The US Senate and House of Representatives have approved a US debt ceiling increase to $28.9T. The $480B increase is only temporary, allowing the US Government to pay its bills through to early December.
The final vote in the narrowly controlled House of Representatives fell across party lines. Every “yes” vote came from Democrats (220) and every “no” vote came from Republicans (212).
This sets the tone for tough discussions into year-end. The Republicans have dug their heels in. The Democrats are willing to negotiate but will likely walk away with a much smaller spending bill.
This once again brings to the table the discussion of how much debt is too much debt. The below chart shows the debt levels of the US Government, US Corporates, and US households in 1990 and 2021.
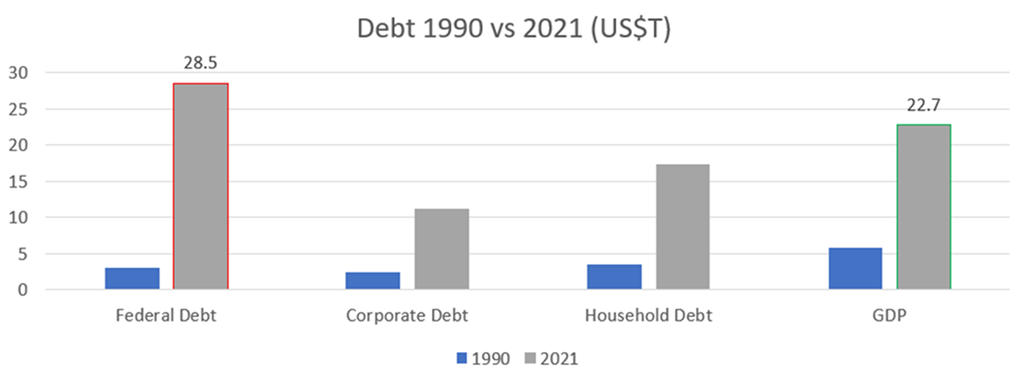
As discussed before, Japan and several European countries saw growth stall when national debt levels (red column) reached 100% of national income/GDP (green column).
The COVID-19 spending programmes has seen the US join the 100% club with US Federal Debt reaching $28.5T. Roughly $21.0T is publicly held (outside US government agencies) and only marginally below US GDP of $22.7T.
Not great for future growth prospects especially should debt levels continue to rise and interest rates move higher. Markets may reach a tipping point and decide US Debt to GDP is high enough to warrant concern. This happened in the early 2010s when it decided European debt rose too high.
The ongoing debt ceiling talks may prove as a sideshow for now, but the market may pay much closer attention as we head into year-end and political discussion intensify.
Australian Equities
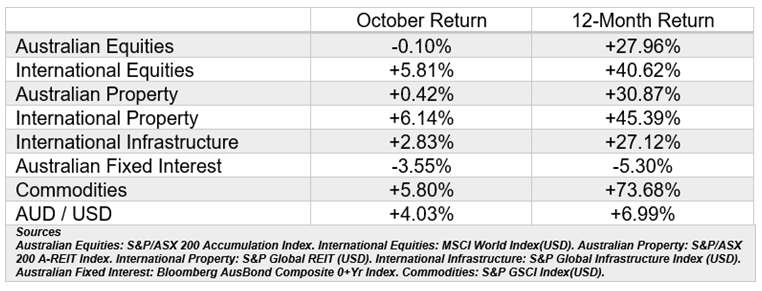
The S&P/ASX200 Index posted a -0.10% return for the month of October resulting in a meaningful underperformance relative to international equities.
Top-performing sector was the more defensive technology (+2.10%) and healthcare (+0.97%) sectors. Leading the technology sector higher was strong results from Xero (+7.60%).
The weaker part of the Australian market for the month was the Industrial (-3.25%) and Energy (-2.69%) sectors. Leading the Industrial sector lower was Transurban (-5.10%) and Brambles (-6.8%).
International equities
The MSCI All-World Index gained +5.81% in October bouncing back strongly from the weakness in September. This places the 12-month return for international equities at +40.62%.
Regional strength over the last month was seen in the US with the US S&P500 Index gaining +7.01%. Quarterly earnings eased most supply chain and earnings growth concerns driving the index to new record highs.
The S&P Europe350 Index followed the US market higher gaining +4.43% whilst the S&P Japan500 Index gave back -2.89%.
The S&P Dow Jones Emerging Market Index gave back -0.94% and remains out of favour relative to Developed Markets. The S&P China500 Index recovered +2.47%.
Property and Infrastructure
Australian Property Index gained a marginal +0.42% over the month of October. Global Listed Property (Hedged) gained a strong +6.14% for the month recovering last month’s -5.52% loss.
Hedged Global Listed Infrastructure gained +2.83% for the month and continues to deliver as the global economy reopens.
Fixed income
The Bloomberg Australian Bond Index gave back -3.55% over the month as markets priced in higher future interest rates.
The 10-year Australian government bond yield continued to move higher in October. Now paying investors +1.95% per annum which is much higher than the +1.16% of just two months earlier.
GENERAL ADVICE WARNING
The advice contained within this document does not consider any person’s particular objectives, needs or financial situation. Before making a decision regarding the acquisition or disposal of a Financial Product, persons should assess whether the advice is appropriate to their objectives, needs or financial situation. Persons may wish to make their assessment themselves or seek the help of an adviser. No responsibility is taken for persons acting on the information within this document. Persons doing so, do so at their own risk. Before acquiring a financial product, a person should obtain a Product Disclosure Statement (PDS) relating to that product and consider the contents of the PDS before making a decision about whether to acquire the product.